Putting the Bus at the Heart of our Communities
There is a perception that in Britain buses used to be central to our lives and communities, but this has been lost through decades of privatisation, underinvestment and rising private car ownership – but is it true?
Trapeze recently commissioned a research project which engaged a diverse group of London bus users with quantitative and qualitative surveys. The intended focus of this project was primarily around information delivery, but as we delved into the responses something interesting emerged: we discovered that respondents feel strong emotional bonds with bus travel.
We weren’t surprised to hear that people trust in and rely upon buses. But less expectedly, a significant proportion said that they enjoy travelling by bus and that this directs their travel decisions. This is a welcome message given concerns over climate change, air quality, rising car use following Covid-19 – and the fact that public transport commercial models have been stretched to breaking point by the pandemic.
To tackle these challenges, we must transform mobility in this country. But those of us who care passionately about bus travel can take heart from this research, because if this is true in a large city like London, wouldn’t it be equally so elsewhere? (But that is a question for another day.)
If we can build on the emotional attachment to bus travel, we can place buses firmly at the heart of our communities – in doing so, creating a brighter, cleaner and healthier future for us all.
Emotional and Social Connections with Bus Travel
Writer and environmental activist George Monbiot once wrote that public transport journeys promote social interactions, and opined their loss when replaced by private car journeys: ‘when you drive, society becomes an obstacle. Pedestrians, bicycles, traffic calming, speed limits, the law: all become a nuisance to be wished away.’
Further to this, there is evidence from San Francisco and Bristol, that high traffic levels reduce social interactions. In his book Out of the Wreckage, which referenced these studies, Monbiot concluded that rising car journeys transform streets from common grounds for social connections into places of noise, pollution, and stress.
Though we share such concerns, we were pleased to note that our research points to strong societal attachment to buses. The in-depth diary part of the study indicates that buses are more than functional mobility tools; for some at least there is a genuine emotional attachment, and a sense that many find it a more enjoyable way to travel.
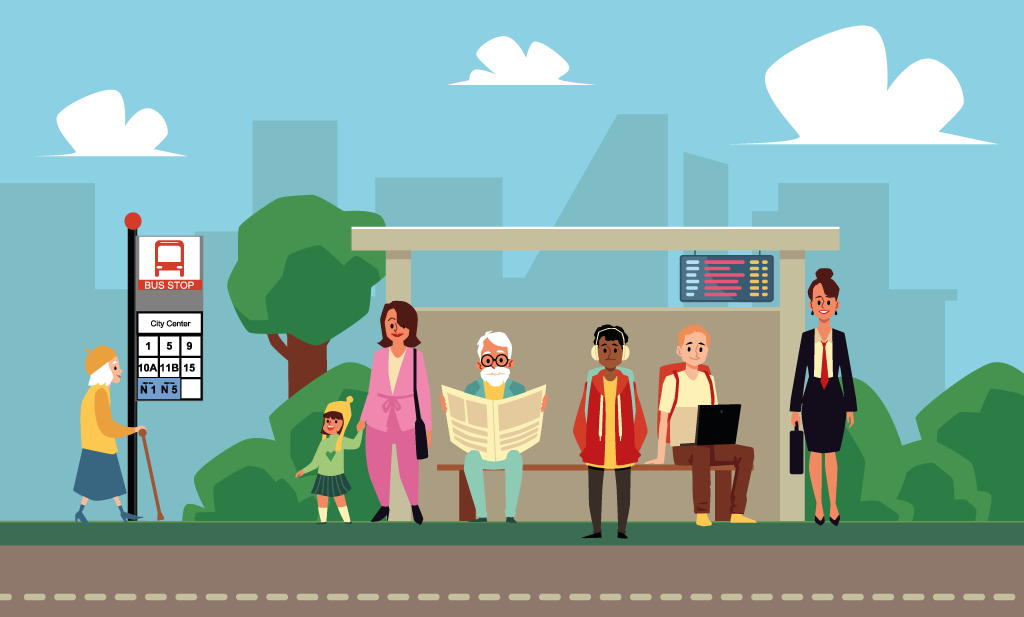
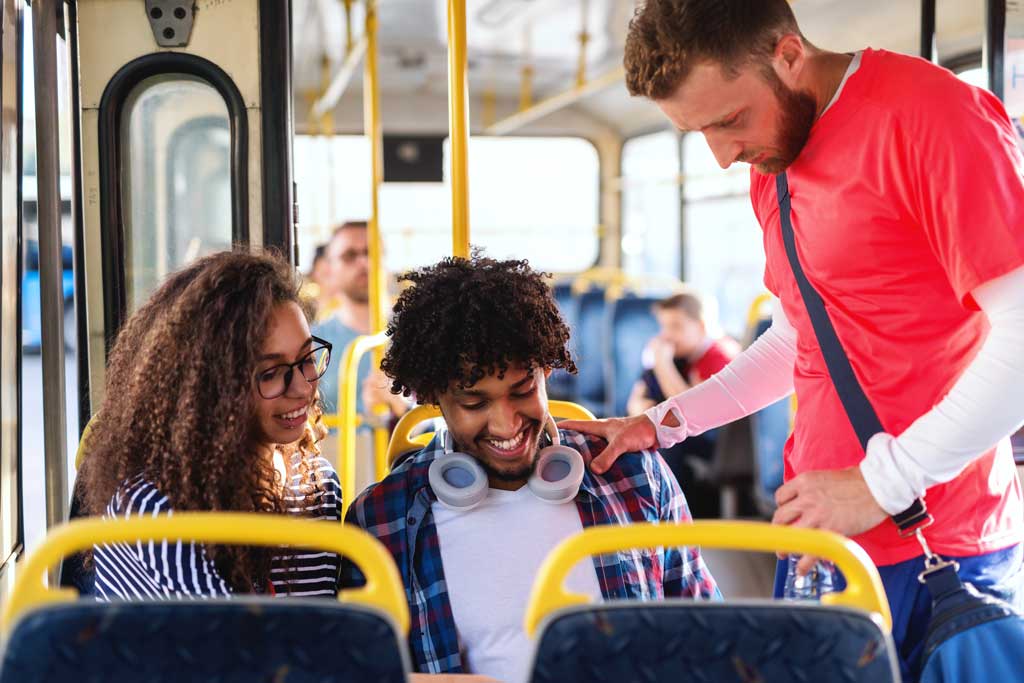
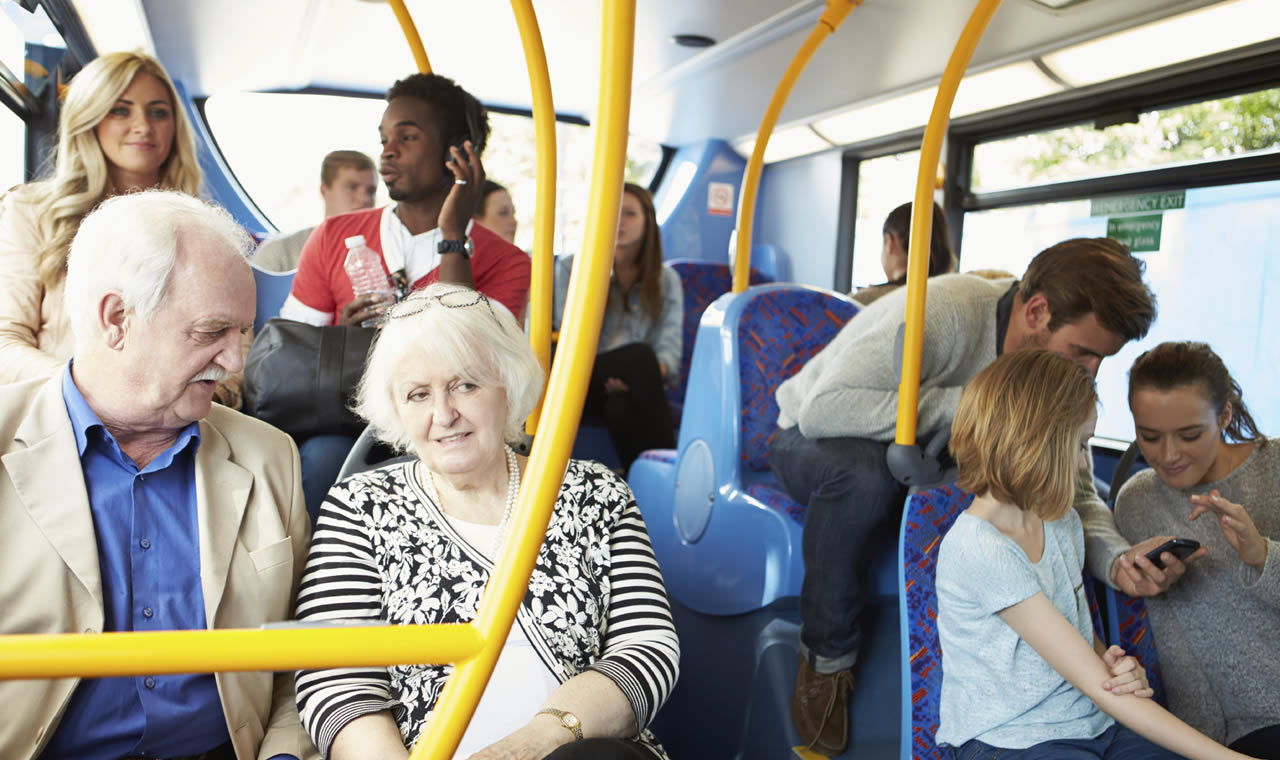
We heard from bus users that value the sense of goodwill between helpful and sociable fellow passengers; and stories of parents with buggies or commuters carrying equipment being helped by fellow passengers in a way that they felt doesn’t happen on other modes of transport.
We also heard that the bus offers a more pleasant experience: a calm atmosphere and the enjoyment of being able to look out windows and see the outdoors. One passenger talked of bus travel as a stress-free way to travel which also affords the opportunity for quality time with a child.
And that sense of community supposedly lost to the past? One participant told of a strong personal relationship with the bus drivers: “All the bus drivers know me so if I’m up the road they wait for me.”
Buses are more than functional mobility tools; for some at least there is a genuine emotional attachment, and a sense that many find it a more enjoyable way of travel.
Inclusivity of Bus Travel
An obvious point that bears repeating: buses are highly inclusive modes of transport. While it is impressive that for our respondents almost half (47 per cent) of all journeys involve a bus, that figure rises to nearly two thirds (64 per cent) for those on lower incomes, for whom its low cost and relative directness are identified as strong factors.
Our research showed that the bus is seen as fundamental in parts of outer London where there are fewer alternatives compared with other parts of the city.
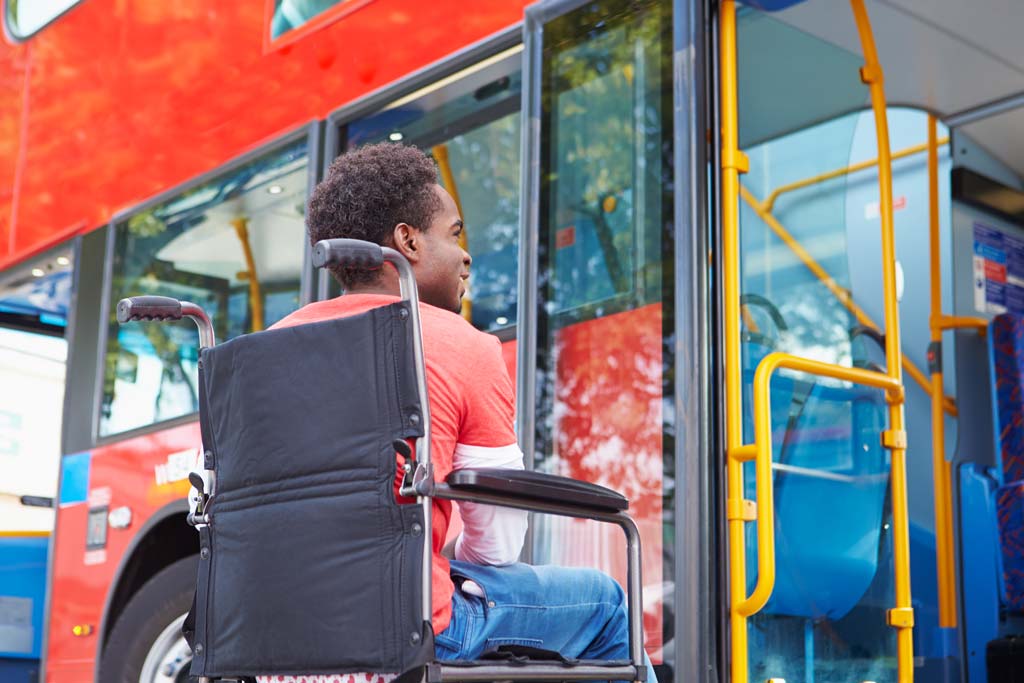
Buses are also vital providers of independent mobility for people with disabilities, with one respondent commenting on the ability to access the bus without having to rely on staff, in comparison with trains and the tube.
Parents of young children are similarly drawn to buses, citing a lack of effort boarding, and the sense that it is nicer being above ground when travelling with a child.
Safety
Our research showed that safety of buses is seen as a positive, with one respondent commenting that buses feel airier and more open, which was seen as an important factor during Covid.
There was also a specific safety element relating to the role that live information plays in making passengers feel safe when travelling home. Two respondents – both female – commented on the importance of having information to help them through this process.
One commented: “The experience when waiting for the bus, especially at night or in quieter areas can make me feel unsafe. So having accurate live information about when the bus is coming can make me feel more reassured on my journey.”
“The experience when waiting for the bus, especially at night or in quieter areas can make me feel unsafe. So having accurate live information about when the bus is coming can make me feel more reassured on my journey.”
%
of passengers are more likely to choose the bus if there is real-time information
Perceptions of Bus Passenger Information
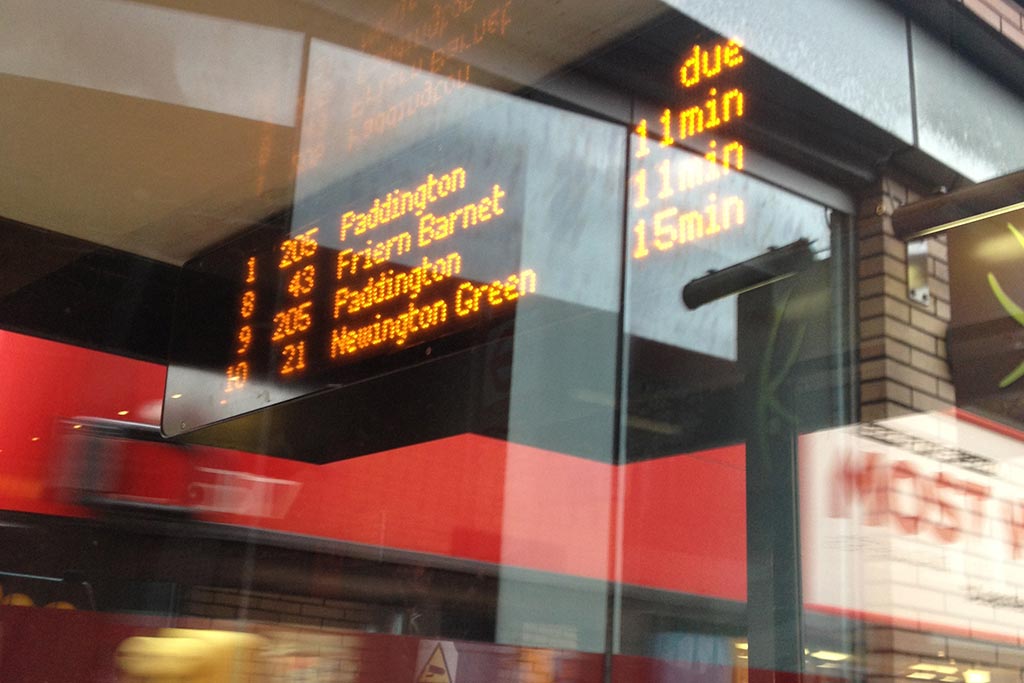
Our research indicates that real-time passenger information is essential to bus patronage: 81 per cent of passengers said they were more likely to choose the bus if there is real-time information, while 84 per cent said real-time information is important for a successful bus journey. By contrast, static/paper-based information is not trusted to the same degree.
It was encouraging to hear that the perception of bus information in London (derived from the iBus system) is incredibly strong: 85 per cent said information for their journey reported during the research was accurate (rated excellent or very good); 85 per cent felt it was easy to interpret; and 82 per cent indicated it was helpful.
The importance of information is further evidenced by the fact that almost all bus journeys are either planned ahead or checked during the journey itself. While all journeys have a high prevalence of planning/checking, more stressful journeys (e.g., busy times, involving multiple buses or at night) are most carefully planned and checked.
We heard that information is important to passengers at all stages of the journey: at the bus stop (82 per cent), at home (80 per cent) and on the bus (75 per cent).
Interestingly, while mobile Apps are perceived positively (rated excellent or very good by 51 per cent of those surveyed), digital at-stop screens remain the highest rated touchpoint (57 per cent), with on-bus audio announcements also extremely valuable (48 per cent), where it provides reassurance and the ability to check progress versus an expected arrival time.
Finally, there was an interesting comment in relation to the importance of information for multi-modal journeys: “Real-time information is key especially since my route into work requires me to catch a bus to catch my train so I need to time my bus ride accurately so I can get to work on time.”
Improving the Bus Experience
While the previous section was encouraging in terms of current perceptions of the bus, the experience must be improved if we are to increase ridership and make buses central to our communities. Our research provided some strong pointers as to how this may be achieved.
Firstly, it is worth noting the reasons why people currently choose the bus: Ease of use, frequency and affordability were predictably the most popular choices – with enjoyment close behind.
In terms of what prevents greater use of buses, speed (a perception that other modes are quicker) emerged as the greatest challenge we face – see the table.
The issue of bus speed is not a new one, and there is evidence that bus patronage is closely linked to journey times: writing for Greener Journeys, Professor David Begg has previously pointed to ‘a direct correlation between operating speeds and patronage: a 10% decrease in speeds reduces patronage by at least 10%’.
Given that there are myriad challenges and potential solutions to this complex issue – documented at length elsewhere – we have instead chosen to focus on improvements which can be made in relation to information delivery.
Improving the accuracy of information, especially during disruption, is an achievable objective which would address many of these identified factors. Some ways in which this could be achieved were discussed in this webinar: True’ Real-Time: Passenger Information to Elevate the Experience and Restore Trust in Buses.
Which of the following, if any, are reasons which prevent you using the bus on more journeys?
- Other transport is quicker 31%
- Some journeys are too long for the bus 29%
- Other transport is more convinient 21%
- I’m concerned about the risk of catching/spreading COVID on the bus 18%
- Other transport is more flexible 16%
- The bus doesn’t travel to the places I need 14%
- Other transport is more comfortable 13%
- Other transport is more reliable 13%
- I don’t know how busy the bus will be (Bus Information) 12%
- I don’t know when the buses will arrive (Bus Information) 11%
- It’s hard to plan my journey by bus (Bus Information) 10%
- I don’t know the route the bus will take (Bus Information) 6%
- I have children/dependants which makes it difficult to take the bus 6%
Source: Quant data (among 500 London Bus users)
Other Suggested Improvements
Meanwhile, we heard several suggestions for changes that could help to address other issues:
Disruption
Passengers find disruption stressful and asked for information relating to both the cause and alternative options. This was raised as a particular concern for passengers with disabilities, for whom diversions can be even more challenging.
Consistency
There was frustration at a perceived lack of consistency of information (e.g., not all bus stops displaying information in the same way, or at all), and a request for a common experience across the network. There was also a concern about irregular availability of digital signs at stops, even in busy commuter areas.
Accessibility
Wheelchair users asked for better positioning of on-board digital screens so as to be more easily readable, and for real-time information relating to available space on-board (a similar request was made by parents with buggies).
Safety
We heard requests for live occupancy information so that passengers can understand how busy vehicles are and make informed travel decisions.
Connections
Almost two thirds of respondents would be more likely to use the bus if it included more onward options. Of the modes cited, tube was predictably the most popular (suggested by almost all respondents), but walking (62 per cent) and cycling (29 per cent) were also significant. Availability of secure bike locks was cited as a data point that could increase bus patronage.
On-Board
Passengers asked for easily interpretable on-bus information, e.g., a tube-style map to make clear where they are within the bus’s overall route, better information relating to upcoming stops (not only the next one), and estimated time to final destinations.
Personalisation
We heard interesting requests to connect planned journeys with digital calendars, and also the ability to share journey information with friends and family.
Conclusion and Next Steps
Our research indicates that London’s bus passengers are happy with services. Information is essential and also fundamentally trusted. However, there are clear pointers as to how patronage could be increased by improving access to key information that would enable passengers to plan smooth, safe and comfortable journeys.
One additional element that came out of our research related to buses as part of a sustainable mobility network. When prompted on the issue, we heard that over half of respondents are interested in information relating to the carbon footprint for their journeys. Interestingly, this figure was higher for respondents in the 16-34 and 35-54 age brackets – suggesting that demand for such information will grow in the future.
Related to this, we asked if the knowledge that bus journeys have a lower carbon footprint would make passengers more inclined to choose the bus (in comparison with a car or taxi) in future. 61 per cent of passengers agreed – and again, this was much higher for 16-34 and 35-54 year-olds than those over 55.
Responses here suggest that such information should be treated sensitively: people would like to be informed but not made to feel guilty. Nevertheless, there is evidence that people are interested, and recognise the importance of the bus in a wider green ecosystem.
All this points to a potential way to further drive bus patronage. We know what is important to bus passengers, and the improvements they wish to see. Furthermore, by aligning bus patronage with local air quality and wider climate crisis concerns we can continue to drive the link between buses and the wellbeing of local communities.
While traditional functional considerations for choosing the bus (easy, convenient, affordable) are of course key, we should also recognise that the emotional bond between the public and buses remains strong. By building on this and placing the bus at the heart of our communities we can ensure we deliver inclusive, safe and sustainable mobility for all.
The emotional bond between the public and buses remains strong. By building on this and placing the bus at the heart of our communities we can ensure we deliver inclusive, safe and sustainable mobility for all.
Do you want to know more? Get in touch now!
A Note on the Research Project
On Trapeze’s behalf, PA Consulting undertook consumer research to explore how passengers use London buses, how they seek and use information about their journeys and how information provision could be enhanced. This was undertaken via a three-strand approach:
Community
- 5-day online community with 21 Passengers
- Ongoing diary activity in which they logged each journey over the five days – what the journey was, what information sources they used, experience of seeking information, any improvements. Participants logged 182 journeys in total
- Additional activities to ‘deep dive’ into current bus information usage and ideas/expectations for future information systems
Focus groups
- 4 x 90-minute online focus groups with a total of 24 Passengers
- Exploring bus usage and information usage
- Delving deeper into some of the specific questions to be answered
Survey
- 7-minute long online quantitative survey with 500 Passengers
- To provide robust stats to back up the qualitative phases
- Each phase of the research was representative in terms of age, gender, ethnicity, and income, with representation from disabled passengers and those with young children.
While we attempted to make our sample representative of Londoners in relation to a range of factors, we acknowledge that in choosing to focus on active bus users the sample could never be entirely representative – it does of course inevitably exclude non-bus users.
Trapeze Group respects your privacy
